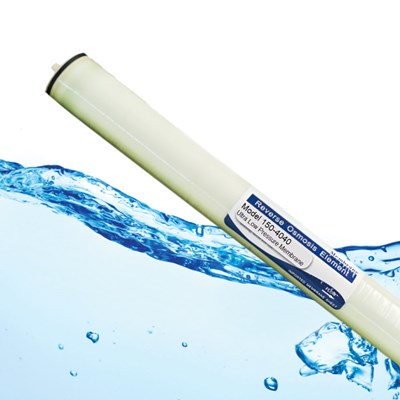
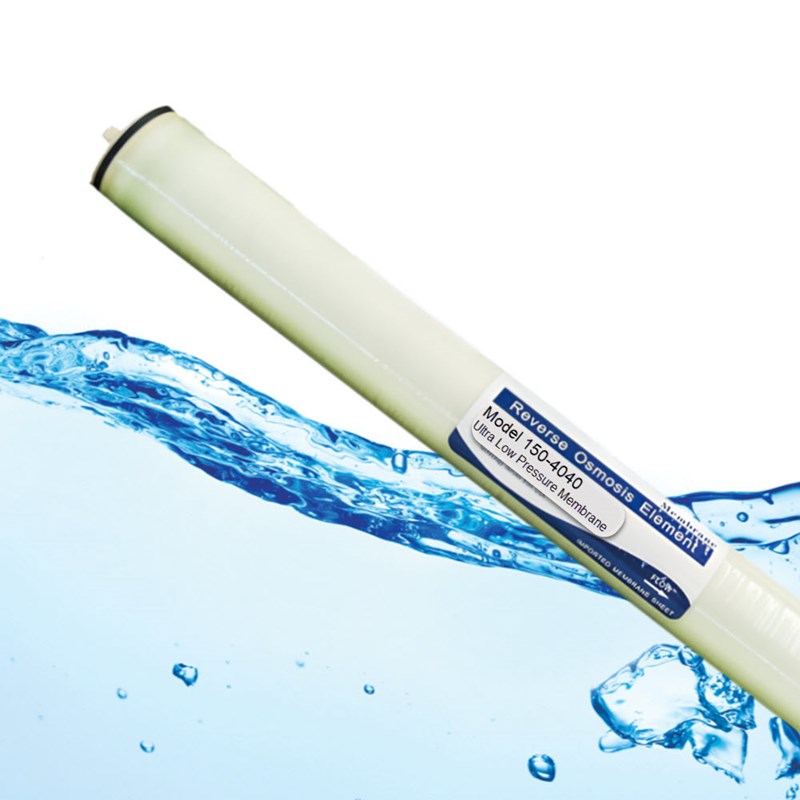
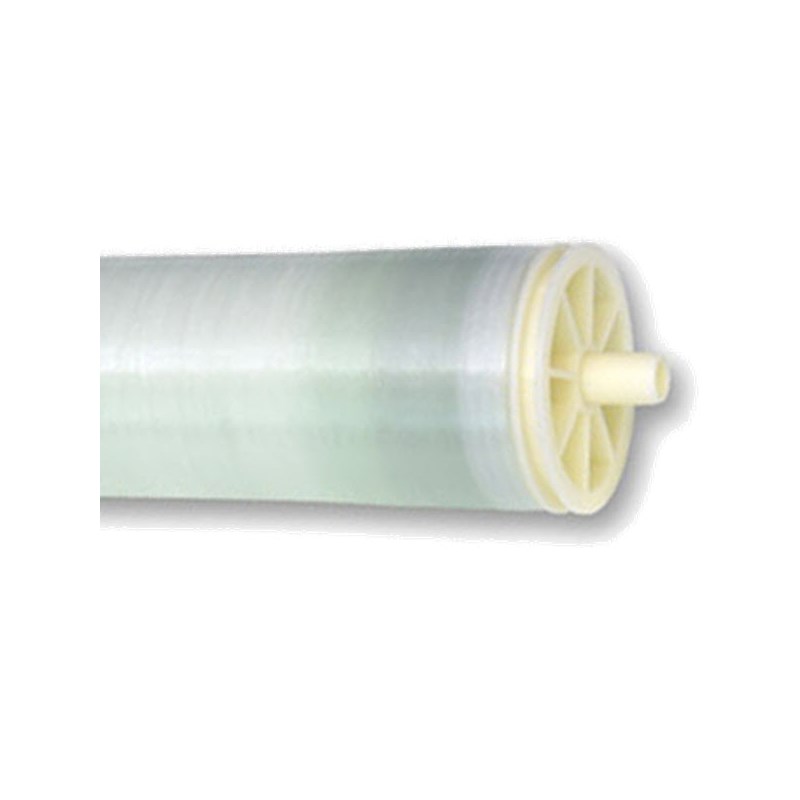
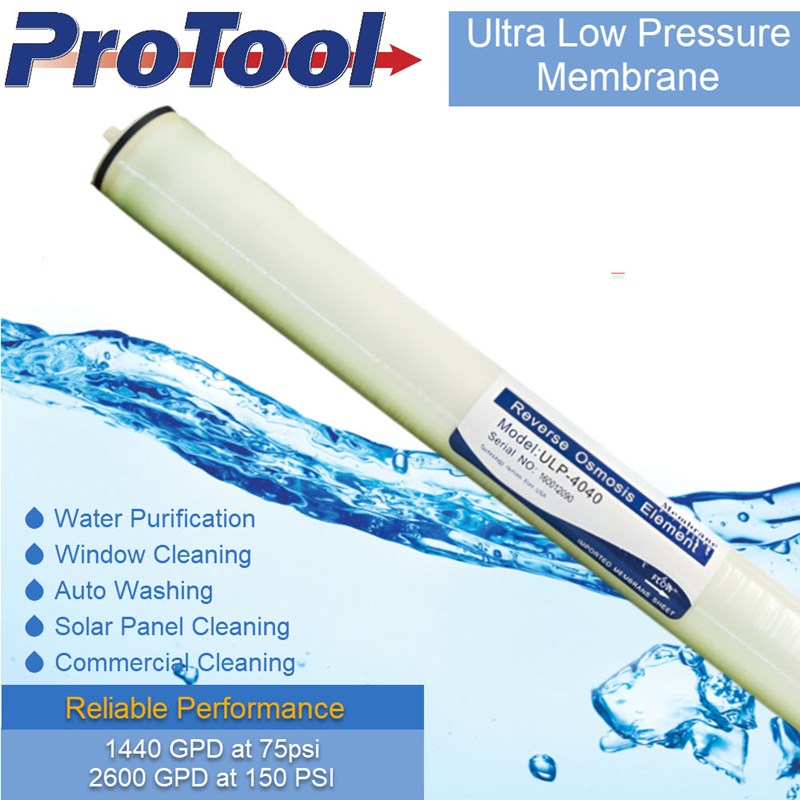
ProTool RO Membrane 4040 Ultra Low Pressure
Quick Overview
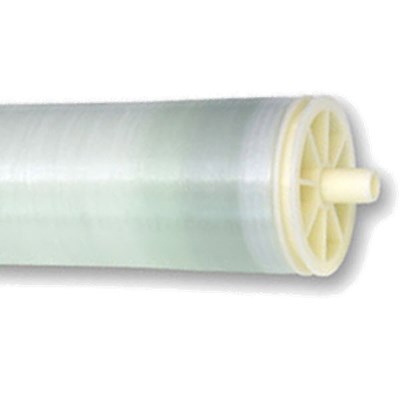
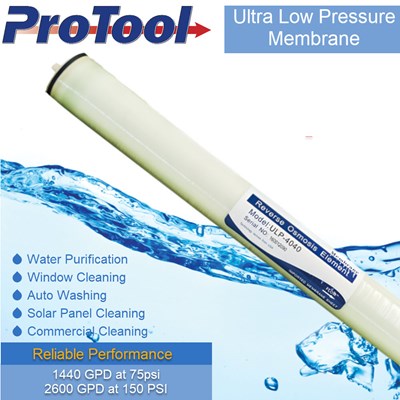
- Ultra Low Pressure RO Membrane offers performance from 70psi to 150psi
- Offers a Dissolved Solids Reject rate better than 99% at 150psi
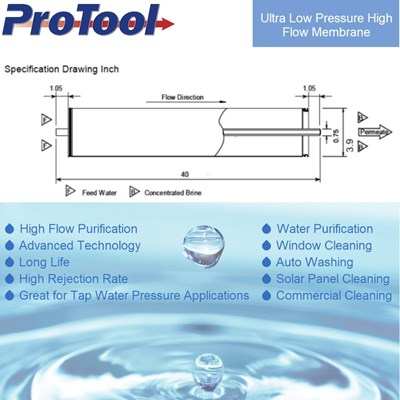
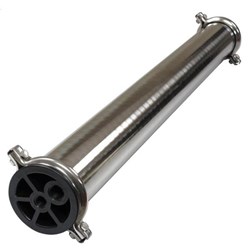
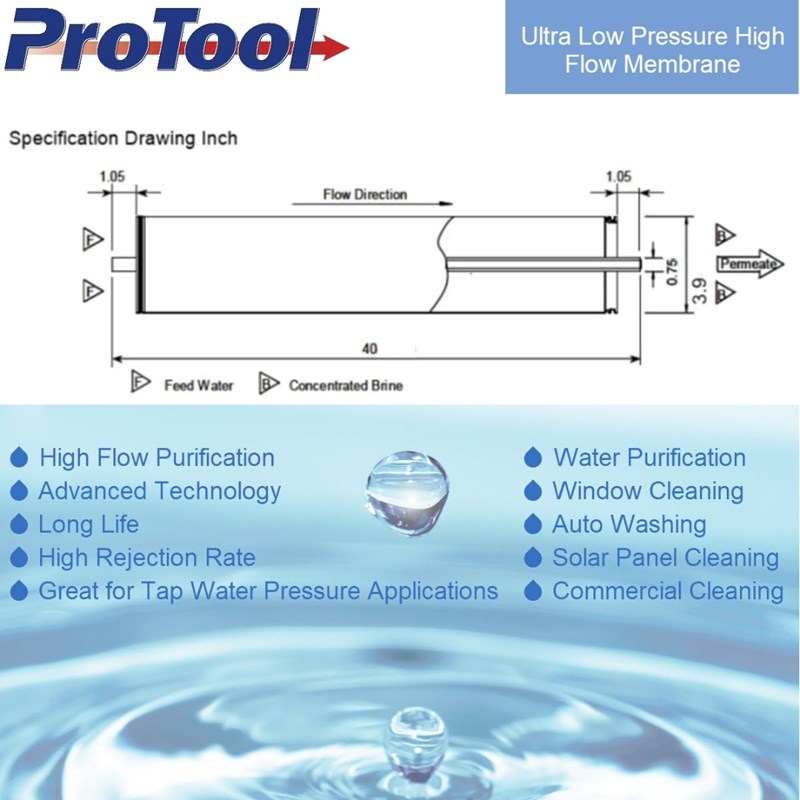
- 4in x 40in Industry Standard size for use with most all RO Housings available
- Output is 2500 Gallons per day at 150 psi and 70 degree or warmer water, 1200 Gallons per day at 70psi and 70 degrees F
- Advanced membrane technology offers consistent performance and reliable water filtration
Show More
$226.95
$278.15
Spare Part for:
Ultra Low Pressure RO Membrane Element - ProTool
RO or Reverse Osmosis, is a technology commonly used for water desalination, as well, RO removes dissolved solid and other impurities from water after advanced micro treatment.
Ultra Low Pressure RO Membrane Element - ProTool
Suitable for desalting those water sources TDS lower than 2000 ppm, such as surface water, underground water, tap water and municipal water, etc
A Quality RO Membrane that flows 0.8 to 0.88 Gallons per Minute at Tap water pressure (70psi, 72F water) amnd 1.3 gpm when running at 110psi and 70 degrees F water temperatureUltra Low Pressure RO Membrane Specifications:
- Active Membrane Area: 78 sq.ft.
- Average Permeate Production: 2500 Gallons per Day
- Testing Pressure: 150, Temperature: 77F
- Operating Pressure: 60psi to 150psi
- Rejection Rate: Greater than 99%
- Max Temperature: 113FPH
- PH Range Of Feedwater Allowed during Operation: 3~10ph
NOTE: Store RO membranes above 34 degrees F to avoid damaging the filters. Do not let the membranes freeze.
The following chart offer a rule of thumb guide for calculating the impact of Temperature and Pressure on the Rated capacity of a RO/DI system.For the purposes of this chars we are using an RO system rated at 1 gpm flow @ 77F water and 80psi input pressure
We can combine these two adjustments into a table and gauge the total impact on flow for Water Temp and Input Pressure
A 1gpm Rating at 77F and 80 psi will turn into these performance measures:
| Water | Temp | |||||
| Pressure | 41 F | 52 F | 63 F | 77 F | 84 F | |
| 55 psi | 0.27 | 0.39 | 0.51 | 0.69 | 0.78 | |
| 60 psi | 0.29 | 0.42 | 0.56 | 0.75 | 0.85 | |
| 65 psi | 0.31 | 0.46 | 0.61 | 0.81 | 0.92 | |
| 70 psi | 0.34 | 0.49 | 0.65 | 0.88 | 0.99 | |
| 80 psi | 0.39 | 0.56 | 0.75 | 1.00 | 1.14 | |
| 90 psi | 0.44 | 0.63 | 0.84 | 1.13 | 1.28 | |
| 110 psi | 0.53 | 0.77 | 1.03 | 1.38 | 1.56 | |
| 130 psi | 0.63 | 0.91 | 1.21 | 1.63 | 1.85 | |
| 150 psi | 0.73 | 1.05 | 1.40 | 1.88 | 2.13 | |
| The center chart area indicates the likely water output for a given Water Temp and Pressure by estimating the resulting flow in gpm | ||||||


RODI 20in Filters with 1 Standard flow RO and 1 RO Boost Pump
